Sweetviz: EDA (Exploratory Data Analysis) in two lines of code in Python
Sweetviz: Powerful Automated EDA in Python
Overview of Sweetviz
Sweetviz is an open-source Python library used to perform quick EDA (Exploratory Data Analysis). The library offers beautiful, high-density visualizations for EDA with only a few lines of code. The output file generated will be a 1080p widescreen fully self-contained HTML application opens in your default web browser. The latest version of Sweetviz is 2.1.0 released on April 1, 2021.
Sweetviz not only helps in quick visualization of target variables but also offers the comparison of Train and Test data in various aspects. It also offers the functionality to compare two subsets of the same data set with its compare_intra() function. For example feature with multiple categories. example Region with values as America, Europe, Nordic, Middle East, Africa, and Asia. We can compare America with others(Europe, Nordic, Middle East, Africa, and Asia) using compare_intra(…).
Sweetviz has three main functions for performing EDA and creating reports:
- analyze(…):- This will analyze the whole data frame, just like normal EDA.
- compare(…):- This function helps us compare train and test data sets.
- compare_intra(…):- I will help in comparing the two subsets of the same data sets.
Lets see the implement of Sweetviz in python:-
Import Libraries

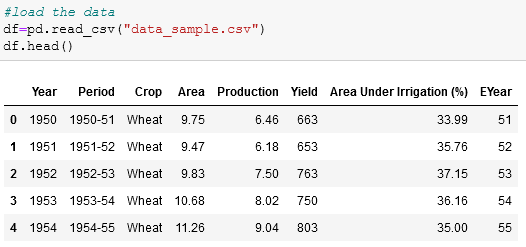
Load the dataset
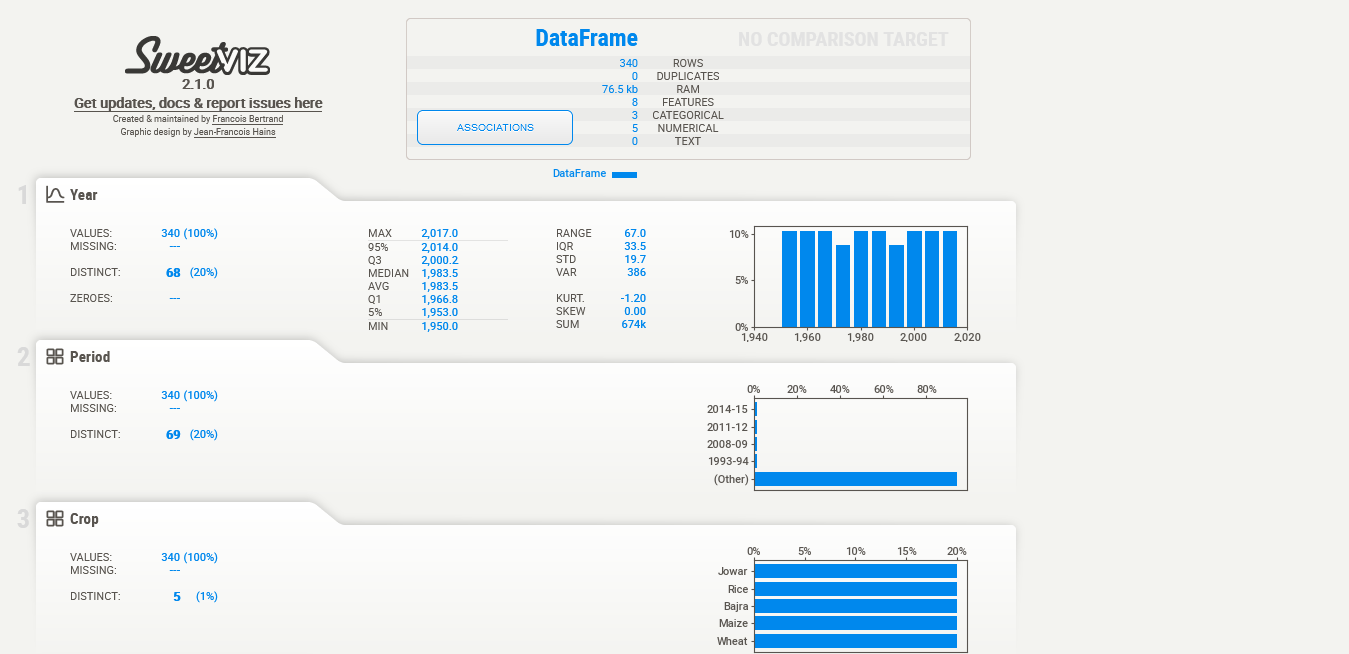
Perform EDA using Sweetviz analyze() function
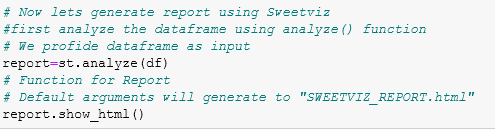
After running the code we get Sweetviz EDA report in our new tab.
Functions such as analyze() and show_html() takes multiple arguments, to know these arguments you can check it on official website.
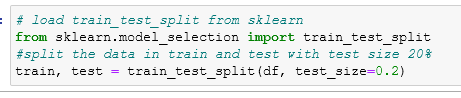
The second function is compare(). It takes two main arguments (train and test data sets). If the data is in single file you can use sklearn train_test_split function to divide it.
Compare the train and test data using compare() function.
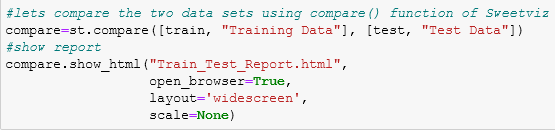
Result will be like this:-

Compare two subset of same dataframe using compare_intra() function:-

Output will be a EDA report comparing the two subset of same dataframe:-

Conclusion- Sweetviz offers very quick EDA with interactive, high-density visualization. It is easier to implement and generates a sharable report. The EDA report contains more insights as compared to manual EDA process.
For more detail regarding parameters of functions you can visit the official link- https://pypi.org/project/sweetviz/ and for above code sample Github link- https://github.com/Mohammad-juned-khan/Sweetviz-EDA-Sample .
Comments
Post a Comment